- E. Pivetta
- Commentaries
Educational corner: reclassification
- 3/2016-Ottobre
- ISSN 2532-1285
Pivetta E.°
Maule M.M.’
Division of Emergency Medicine and Cancer Epidemiology Unit, Department of Medical Sciences, University of Turin °
Cancer Epidemiology Unit, Department of Medical Sciences, University of Turin ‘

Background (Why?)
For many years, the usefulness of a new diagnostic tool was evaluated considering its accuracy (sensitivity, specificity, prognostic values) and comparing it with a gold standard. This approach has some limitations. In some cases, there is not a real gold standard (e.g. there is no such test for the diagnosis of acute heart failure among dyspneic patients). Furthermore, sometimes accuracy does not reflect the real utility of a diagnostic test. For undifferentiated acute shortness of breathe, a chest CT scan or a catheterization laboratory examination have high sensitivity and specificity but are likely to be of low clinical usefulness in the “real world”: how many hospitals can perform these tests during night shifts? Or what is the real use of a nearly 100% accurate test, provided we can find one, if it entails prohibitive costs?.
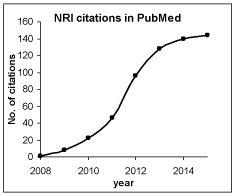
Recently, Michael Pencina and colleagues (1) suggested a new index to quantify usefulness in daily clinical practice based on reclassification tables. They called it net reclassification index (NRI). It has received a lot of attention (see Figure), it has quickly become very popular among cardiologists and oncologists and, at the same time, it has already received some interesting methodological criticisms. (2)
Figure – Net reclassification index citations in PubMed.
Definition (What?)
NRI is defined as the test’s ability to change correctly a diagnosis based on an existing prediction model (e.g. clinical workout) among events and non-events.
The idea of Pencina and colleagues was to avoid, or at least reduce, the difficulty in understanding the results of other performance tests, such as interpreting the area under the receiver-operating characteristic curve – AUC). The AUC represents the probability that the risk predicted by the test is higher for a case than for a non case.
The magnitude of improvement obtained using a new test, defined as difference between AUCs for the new and the old test, is often small, and its usefulness in a clinical setting difficult to judge. In other words, is a test with AUC = 0.785 more useful than a test with AUC = 0.78? We know for sure that, provided that we have measured accuracy with enough precision, the first test has higher accuracy than the second, but what about its ability to change medical decisions or therapeutic options?
NRI tries to answer this questions by quantifying the proportion of correctly reclassified cases among events and non-events.
Example (How?)
Let us consider a new biomarker for the diagnosis of pulmonary embolism (PE) among subjects with shortness of breathe. The gold standard is provided by a chest angioCT scan, whereas the usual test is dosage of d-dimer.
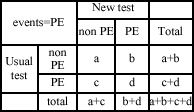
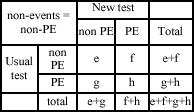
After assessing AUCs for both predictive models, you can build 2 reclassification tables, one for the events (the real PEs, defined by a positive chest angioCT scan – Table 1), and another for non-events (dyspneas related to causes different from PE – Table 2).
Table 1. Reclassification table for real PEs.
NRI for the events is the difference between non-events reclassified as events by the new test (b) and events reclassified as non-events by the new test (c), divided by the number of true events: NRIevents = (b-c)/(a+b+c+d).
NRI for the non-events, NRInon-events, has a similar definition: (g-f)/(e+f+g+h).
Table 2. Reclassification table for real non-PEs
A common pitfall is to interpret the overall NRI, defined as NRIevents + NRInon-events, as the percentage of truly reclassified subjects. Although based on the sum of two percentages (the percentage of truly reclassified subjects among cases and the percentage of truly reclassified subjects among non cases), the overall NRI is not a percentage: the denominators of the 2 fractions are different.
Tips for managing NRIs
– report reclassification tables for both events and non-events;
– report both NRIs, for events and for non-events;
– if you want to show the overall values, do not interpret it as a proportion or a percentage.
When?
– To evaluate influence of a new diagnostic tool on the clinical practice after and in addition to assessing its diagnostic accuracy (e.g. sensitivity, specificity, likelihood ratios, c-statistic, AUC…);
– with categorical or continuous outcomes;
– in association with reclassification tables.
Bibliography
1) Pencina MJ, D’Agostino RB Sr, D’Agostino RB Jr, Vasan RS. “Evaluating the added predictive ability of a new marker: from area under the ROC curve to reclassification and beyond”.
Stat Med. 2008 Jan 30;27:157-72.
2) Kerr KF, Wang Z, Janes H, McClelland RL, Psaty BM, Pepe MS. “Net Reclassification Indices for evaluating risk prediction instruments


